Weather HQ
Australia Weather Map
Toggle radar, observations, warnings and cyclone tracks on a single live map.










SINCE 9AM RAIN · mm
BoM flood warning network
hollow = approximate position
RAIN, RIVER, OBS & WARNINGS © BUREAU OF METEOROLOGY (INCL. WATER DATA ONLINE) · FOR EMERGENCIES CALL 000
Your Location
Local Conditions
National Warnings
Active Warnings
12 major
Tropical Cyclones
TC Activity
No cyclones in the Australian region
Off-season · season starts in November
Climate Intelligence
Climate Drivers
Ocean climate snapshot
ENSO
Strong El Niño
Niño 3.4 · weekly
+3.40°C
week to 21 Oct
IOD
Positive IOD
Sept 2026
MJO
Phase 2
29 Oct · amp 1.44
A strong El Niño is underway — this typically means drier, warmer conditions across much of northern and eastern Australia, with reduced winter–spring rainfall. The MJO is active in phase 2, which tends to suppress rain and storms over northern Australia.
See the full ocean & ENSO dashboardNiño 3.4 anomaly (°C), Nov 2024 – Oct 2026
Local Forecast
Enter your postcode for a personalised 7-day forecast, AI summary, and nearby station history.
Your Location Forecast
Enter a 4-digit Australian postcode or use GPS to get your personalised daily forecast, including UV, rainfall, fire danger and an AI-written plain-English summary.
Climate Drivers
ENSO, IOD, SAM and MJO indices driving Australia's long-range weather patterns.
ENSO
El Niño–Southern Oscillation · monthly
Drier and hotter for eastern and southern Australia. Elevated fire risk.
As of September 2026
IOD
Indian Ocean Dipole · monthly
Reduced moisture flow — drier conditions likely across the south and east.
As of September 2026
SST
Sea Surface Temp (Niño 3.4)
Above-average sea surface temperatures — increased instability and cyclone potential.
As of September 2026
SAM
Southern Annular Mode
Southern Annular Mode near neutral — little steering influence on Australian rainfall right now.
As of September 2026
MJO
Madden-Julian Oscillation
MJO is active and influencing tropical convection.
As of 28 Oct 2026
Madden–Julian Oscillation
RMM phase-space plot
Track runs oldest → newest; the circle at radius 1 marks the weak/active threshold. Newest point highlighted.
Index history
Niño regions — weekly SST anomaly
Published records from NOAA CPC — the same figures quoted elsewhere, rather than our own computation, which would drift from them by whatever the method and baseline differ by.
Shaded above +0.8 and below -0.8, the conventional El Niño and La Niña thresholds.
Want the full 25-year record? It's available on The Front Line.
Sea Surface Temperature Anomalies
Australian / Western Pacific Region — Daily NOAA Coral Reef Watch 5km Analysis
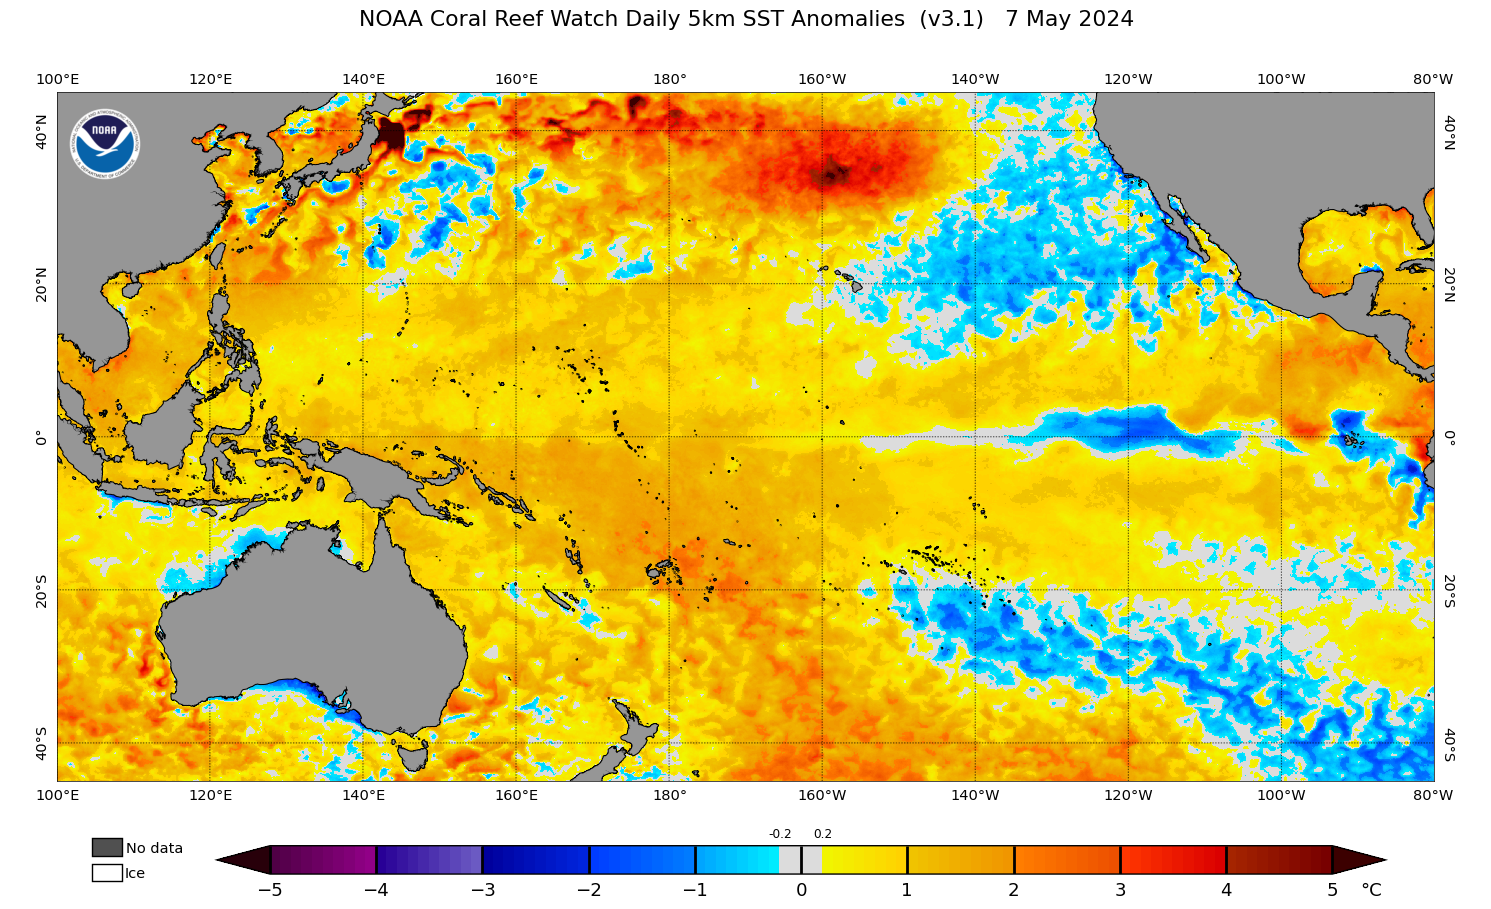
SST ANOMALY (°C)
Below-average SSTs suppress tropical convection and reduce cyclone potential. Cool anomalies in the Indian Ocean may indicate a developing positive IOD.
Sea surface temperatures close to the long-term average. Tropical weather activity is driven primarily by atmospheric patterns rather than oceanic forcing.
Elevated SSTs increase atmospheric instability and fuel tropical cyclone development. Areas of warm anomaly in the Coral Sea and Arafura Sea are high-risk zones during cyclone season.
SOURCE: NOAA CORAL REEF WATCH · 5KM DAILY SST ANOMALY · UPDATED DAILY
Satellite Imagery
Live looping imagery from the Himawari-9 geostationary satellite.
HIMAWARI-9 · TRUE COLOUR · CAPTURED 01 Nov 2026, 00:30 AEST


DATA © JMA / RAMMB-CIRA SLIDER · HIMAWARI-9 · AUTO-REFRESHES EVERY 10 MIN · FULL VIEWER AT RAMMB-SLIDER.CIRA.COLOSTATE.EDU
Data © Bureau of Meteorology · Updates every 10 minutes · Visit bom.gov.au for official forecasts & warnings · For emergencies call 000